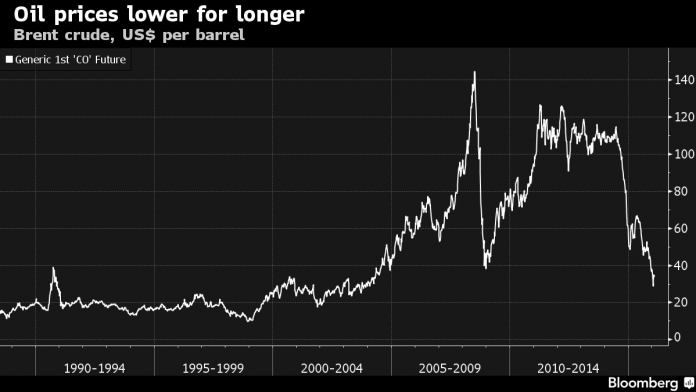
The stunning fall in oil prices, from a peak of $115 per barrel in June 2014 to under $35 at the end of February 2016, has been one of the most important global macroeconomic developments of the past 20 months. The sharp fall is broadly similar in magnitude to the decline in 1985-1986, when OPEC members reversed earlier production cuts, and in 2008-2009 at the outset of the global financial crisis. Understanding the underlying causes of price drops is essential to interpreting their macroeconomic effects. The 1985-86 decline was mainly supply-driven, while the drop in 2008-2009 was almost entirely due to a collapse in demand. The recent price decline appears to be a mix of the two.
Slowing growth in emerging markets, most importantly in China, has led to sharp drops in commodity prices almost across the board. The drop in oil prices, however, has been significantly steeper than in metals and food. The magnitude of the differential is one important metric that suggests that rising supply has been at least as important as falling demand; most mainstream macroeconomic models suggest that the effect on global GDP has been a net positive, on the order of 0.5%. This is significant, but less than past experience might have suggested, though the effect may prove larger if the decline persists.
There appear to be three reasons for this lower impact on global GDP.
First, although the oil price decrease has been largely passed on to consumers in advanced countries, there has been much less pass-through in the rest of the world. Many governments – for example, in China and India – have taken advantage of the decline to reduce subsidies on fuel consumption and thereby strengthen their fiscal position.


